

Retention rates measure the percentage of first-time students who return to the institution to continue their studies the following fall.
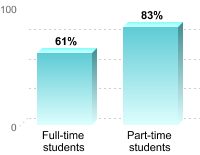
Percentage of Students Who Began Their Studies in Fall 2021 and Returned in Fall 2022
The overall graduation rate is also known as the “Student Right to Know” or IPEDS graduation rate. It tracks the progress of students who began their studies as full-time, first-time degree- or certificate-seeking students to see if they complete a degree or other award such as a certificate within 150% of “normal time” for completing the program in which they are enrolled.
Note that not all students at the institution are tracked for these rates. Students who have already attended another postsecondary institution, or who began their studies on a part-time basis, are not tracked for this rate.
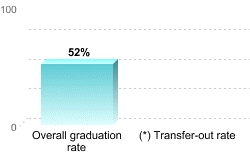
Percentage of Full-time, First-Time Students Who Graduated or Transferred Out Within 150% of “Normal Time” to Completion for Their Program
(*) Not all institutions report transfer-out rates.
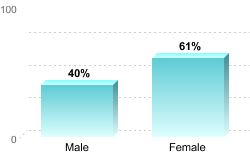
Percentage of Full-time, First-time Students Who Began Their Studies in 2019-20 and Graduated Within 150% of “Normal Time: to Completion for Their Program
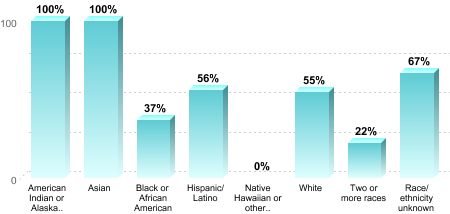
Percentage of Full-time, First-time Students Who Began Their Studies in 2019-20 and Graduated Within 150% of “Normal Time: to Completion for Their Program
Five students received Pell grants for the 2017 – 2018 award year. The graduation rate for the Pell grant recipients was 80%.
No students received a Stafford loan during the 2017-18 award year.
Graduation Rates by Time to Completion
Graduation rates can be measured over different lengths of time. “Normal time” is the typical amount of time it takes full-time students to complete their program. For example, the “normal” amount of time for many associate’s degree programs is 2 years. Not all students complete within the normal time, so graduation rates are measured by other lengths of time as well, including “150% of normal time” (e.g., 3 years for a 2-year program) and “200% of normal time,” or twice as long as the normal time (e.g., 4 years for a 2-year program).
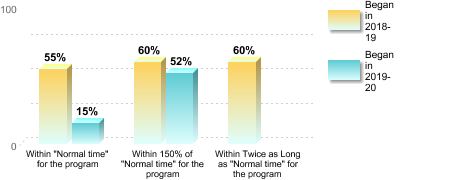
Percentage of Full-time, First-time Students Who Graduated in the Specified Amount of Time